
Building Interactive Visuals with HTML, CSS, and JavaScript
Building Interactive Visuals with HTML, CSS, and JavaScript
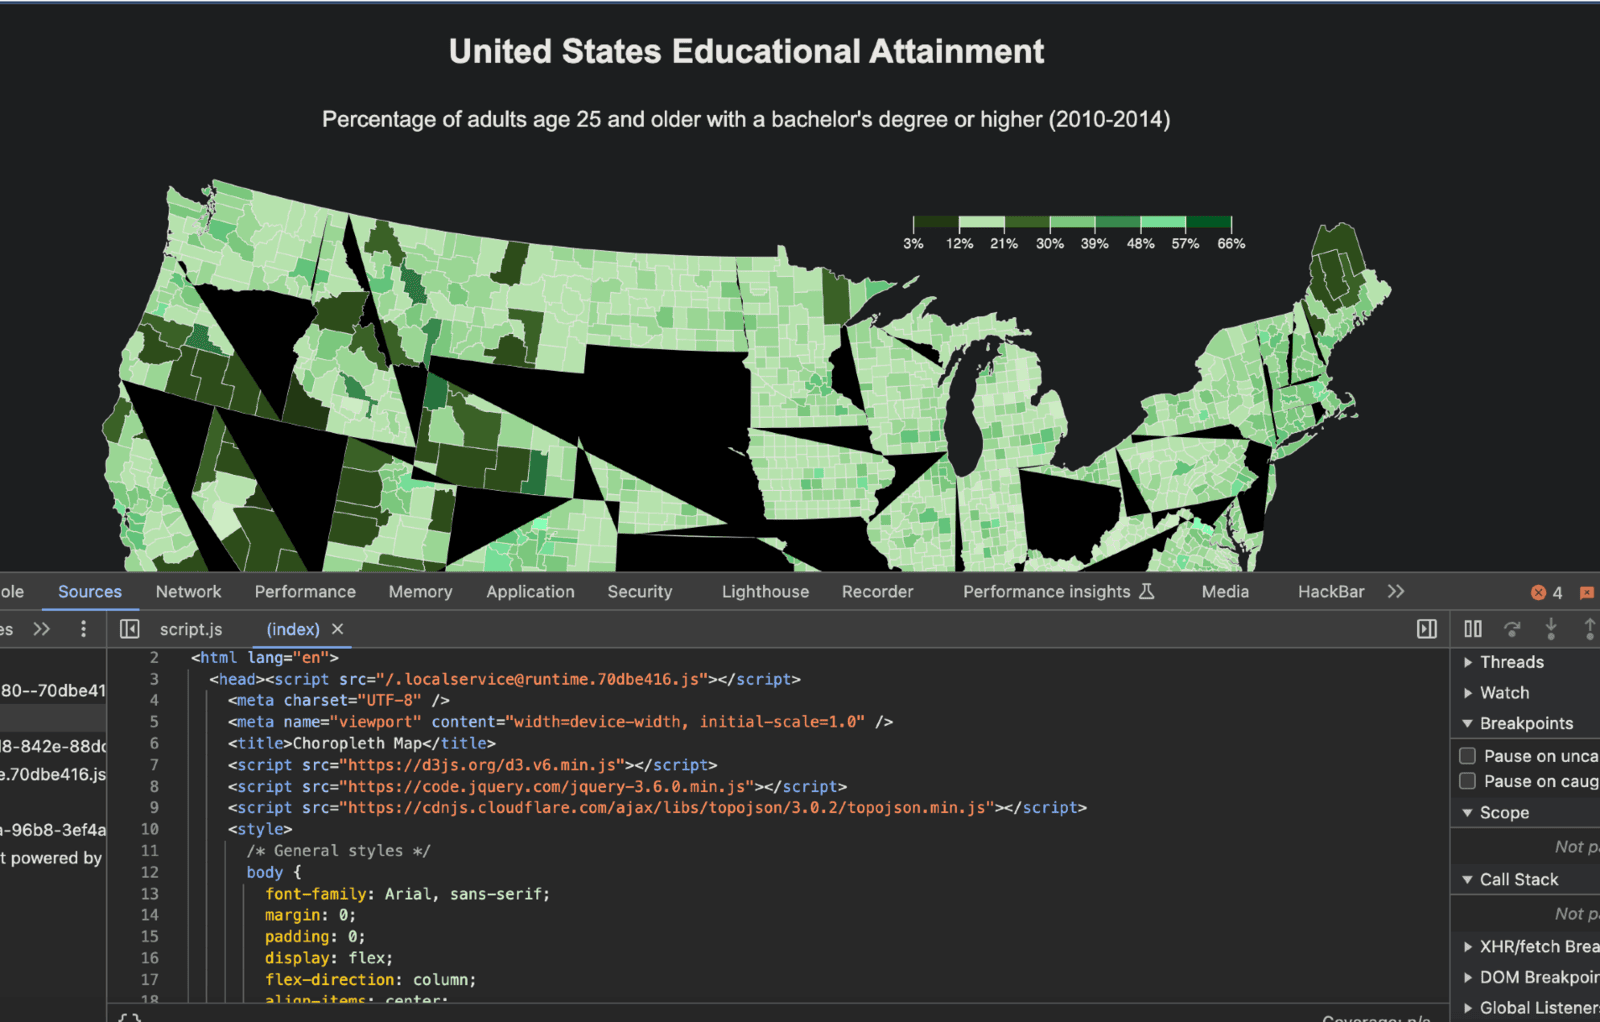
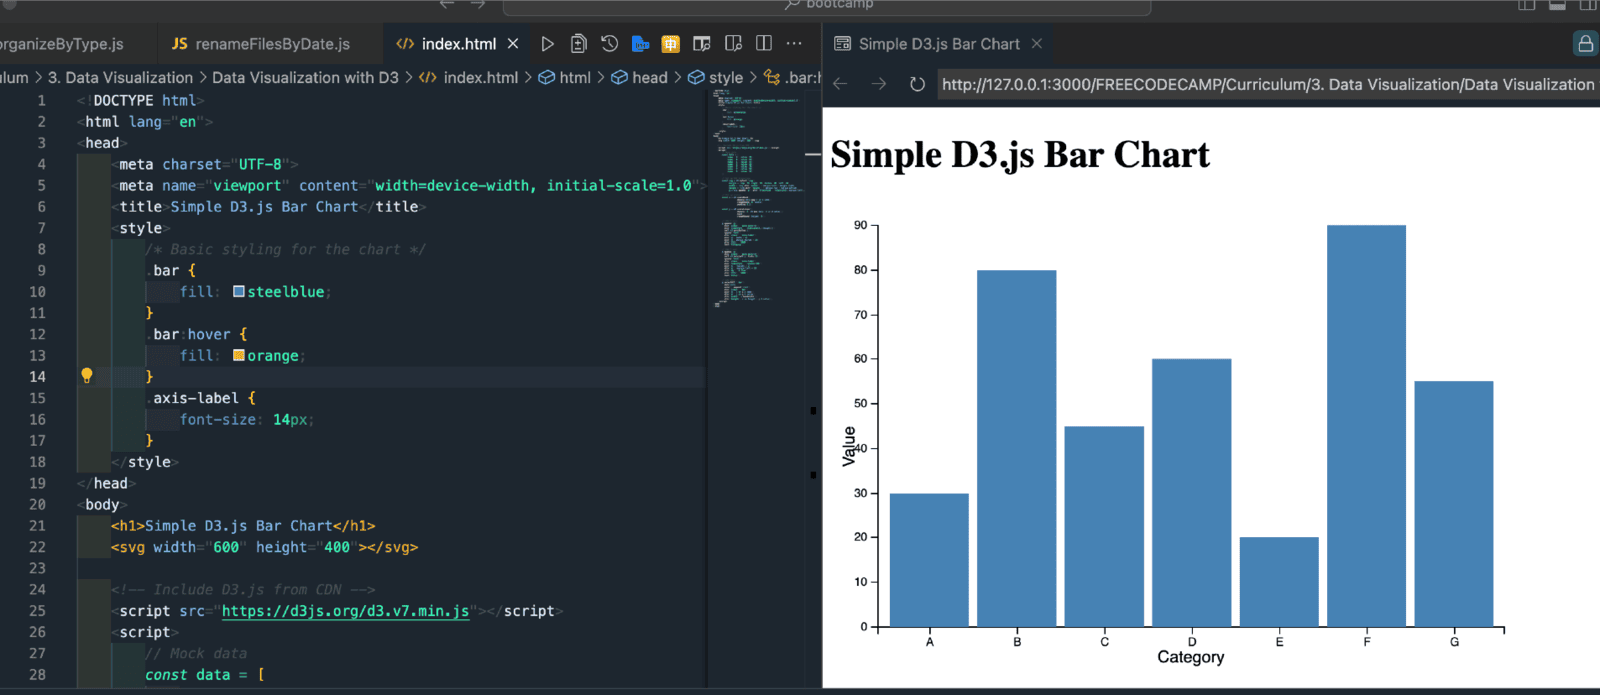
In the ever-evolving world of data visualization, most people have heard of the more established names like Tableau, and Power BI, and anything Python related, but D3.js often goes under the radar. It’s easy to see why. JavaScript was built as a web language to add interactivity to static web pages. Interestingly enough, the same utility it has there, comes into play when using the D3.js library. It allows developers to create fully interactive visuals, inside of just an HTML page. While larger companies are sending dashboards (and charging a lot for them), D3 provides a different way of working with data.
D3.js is a game-changer, especially for lean startups that can't afford to spend resources or man hours on creating structured data just yet. Established companies have their processes and data schemas meticulously organized, down to every column of every spreadsheet. Newer companies, however, need to hit the ground running and figure out the details as they go.
Enter D3.js, the superhero of flexibility. Using just HTML, CSS, SVG (Scalable Vector Graphics), and JavaScript, a small team can build interactive data visuals that are not only flexible but also responsive and easy to maintain. And guess what? It's free! No need to fork out for expensive licenses or deal with rigid controls. Plus, it's open-source. Just drop the CDN link into your script tag in an HTML file, and you're good to go.
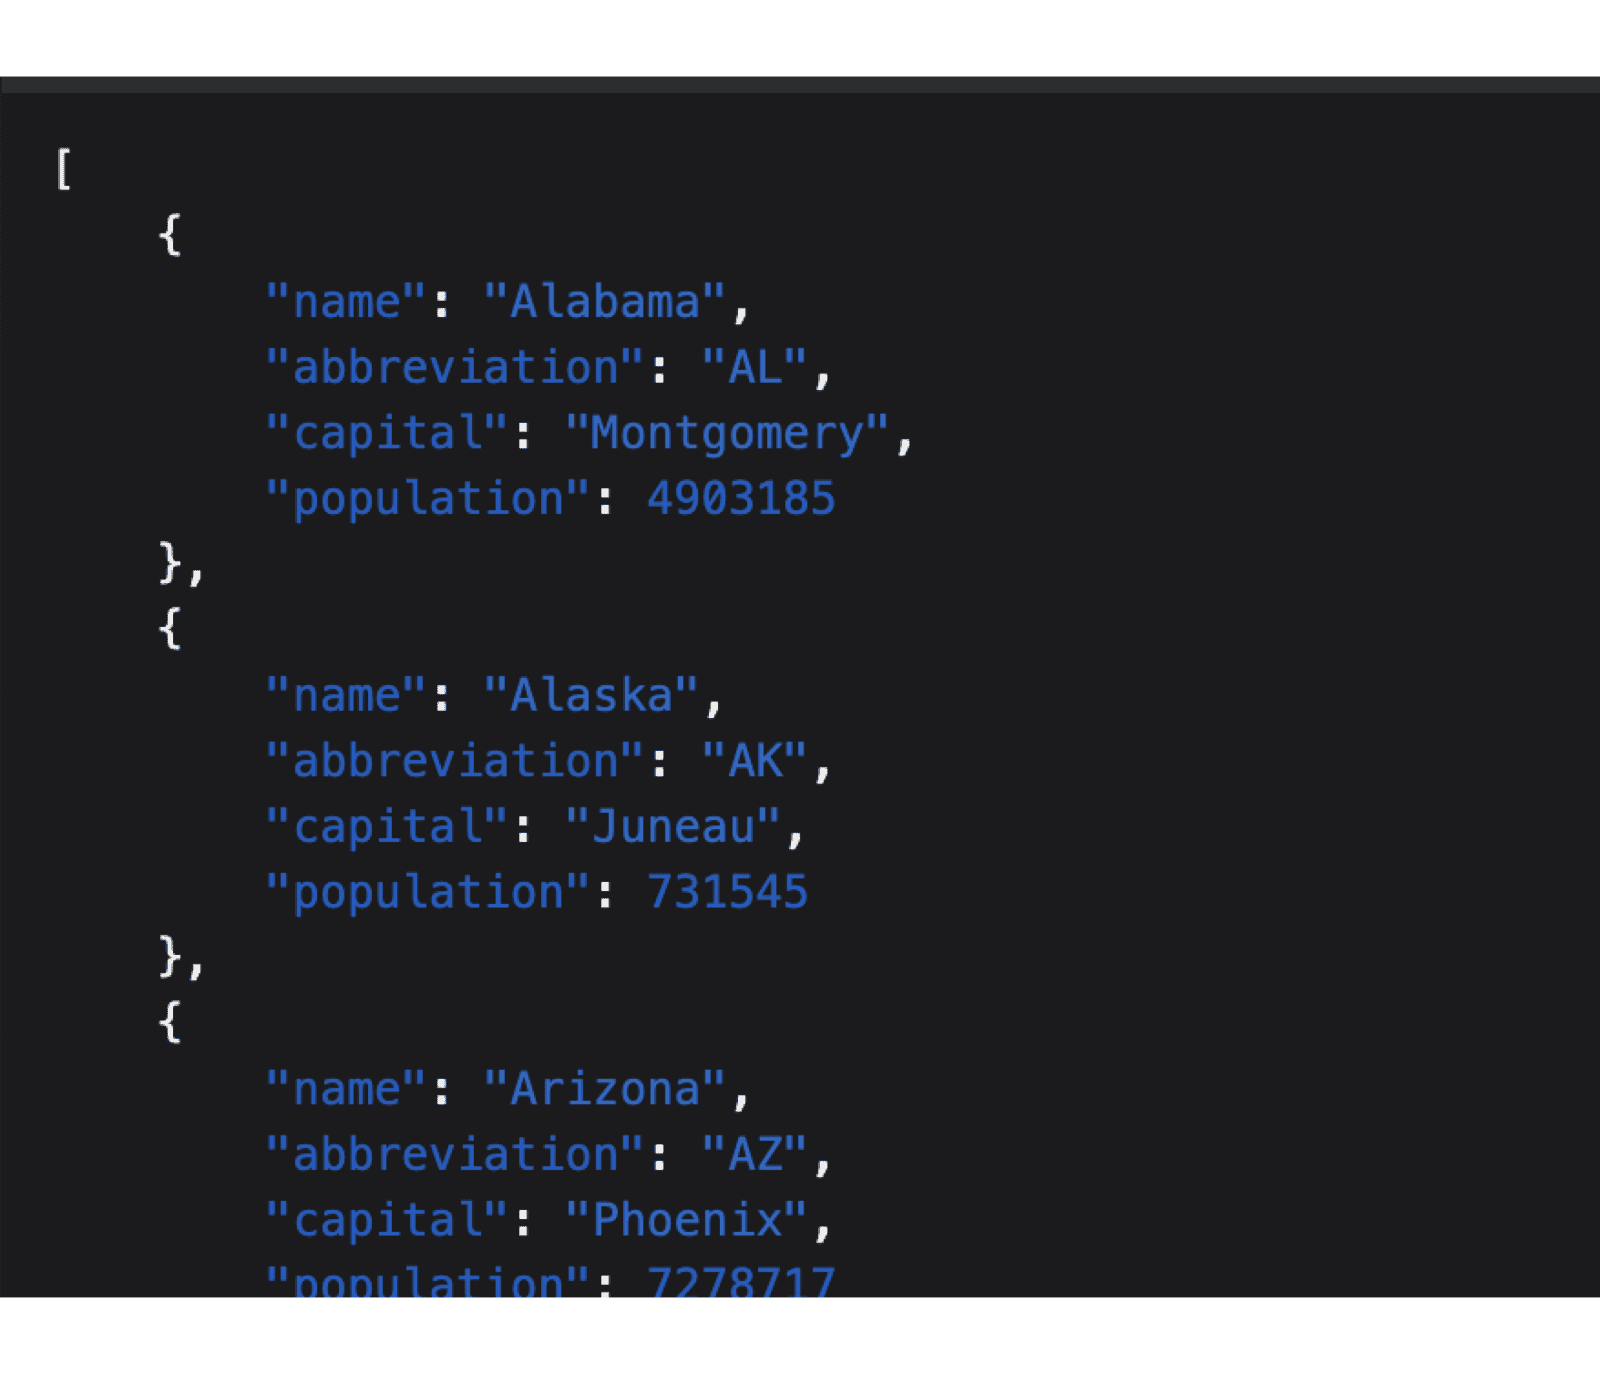
JSON (JavaScript Object Notation)

